The diagram below shows the market demand curve and the cost curves for a single firm.
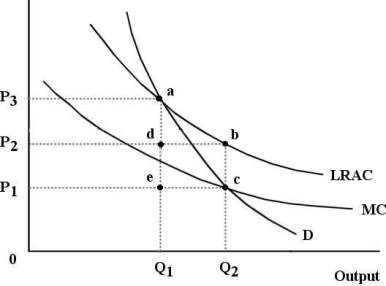 FIGURE 12-6
-Refer to Figure 12-6.Suppose this firm is being regulated using a policy of average -cost pricing.In this case,economic profits to the firm are represented by the area
A) P2P3ad.
B) P2P3ab.
C) 0P3aQ1.
D) P1P2bc.
E) There are no economic profits.
Correct Answer:
Verified
Q49: The diagram below shows the market demand
Q53: Consider the following information for a regional
Q55: The diagram below shows the market demand
Q85: Consider the following information for a regional
Q93: The diagram below shows the market demand
Q101: The diagram below shows cost and revenue
Q109: The diagram below shows the market demand
Q111: The diagram below shows cost and revenue
Q116: The diagram below shows cost and revenue
Q118: The diagram below shows cost and revenue
Unlock this Answer For Free Now!
View this answer and more for free by performing one of the following actions

Scan the QR code to install the App and get 2 free unlocks

Unlock quizzes for free by uploading documents