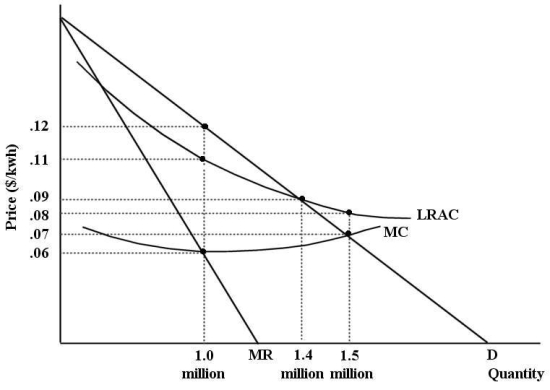
The diagram below shows cost and revenue curves for a natural monopoly producing electricity.Price is dollars per kilowatt hour and quantity is kilowatt hours per day.  FIGURE 12-7
-Refer to Figure 12-7.If this firm were unregulated and profit maximizing,its price and output would be ________ per kwh and ________ kwh per day.
A) $0.08; 1.5 million
B) $0.09; 1.4 million
C) $0.12; 1 million
D) $0.11; 1 million
E) $0.07; 1.5 million
Correct Answer:
Verified
Q111: The diagram below shows cost and revenue
Q112: In Canada,a significant challenge for the Competition
Q113: The diagram below shows cost and revenue
Q114: The objective of government regulation and competition
Q115: In many cases throughout Canadian history,governments have
Q117: There has been a trend toward less
Q118: The diagram below shows cost and revenue
Q119: A major aim of Canadian competition policy
Q120: The diagram below shows the market demand
Q121: In Canada,alleged violations of the Competition Act
Unlock this Answer For Free Now!
View this answer and more for free by performing one of the following actions

Scan the QR code to install the App and get 2 free unlocks

Unlock quizzes for free by uploading documents