The figure below shows a family of cost curves for a firm.The subscripts 1,2,and 3 for the SRATC curves refer to different plant sizes. 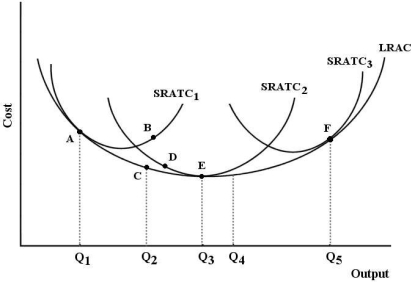 FIGURE 8-3
-Refer to Figure 8-3.If this firm is producing at point B,then
A) this firm is producing a level of output that is technically inefficient in the long run.
B) this firm is experiencing decreasing returns to scale.
C) this firm could produce the same level of output at a lower cost with plant size 2.
D) it should employ more of its variable factors of production.
E) plant size 1 is optimal.
Correct Answer:
Verified
Q80: Q81: The figure below shows a family of Q82: A short-run average total cost curve and Q83: What is the definition of productivity? Q84: A very-long-run consideration that could change a Q86: For many firms the LRAC curve is Q87: Suppose a shipping company employs 2000 workers,operates Q88: The figure below shows a family of Q89: Suppose Farmer Smith hires 4 workers and Q90: Suppose Farmer Smith hires 4 workers and![]()
A)output produced
Unlock this Answer For Free Now!
View this answer and more for free by performing one of the following actions

Scan the QR code to install the App and get 2 free unlocks

Unlock quizzes for free by uploading documents