The figure below shows a family of cost curves for a firm.The subscripts 1,2,and 3 for the SRATC curves refer to different plant sizes.
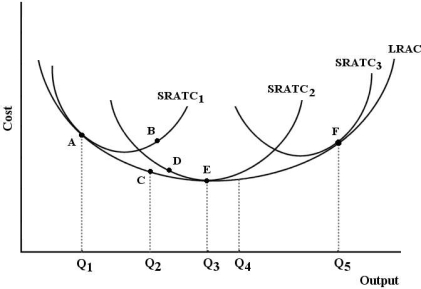 FIGURE 8-3
-Refer to Figure 8-3.Should this profit-maximizing firm ever consider moving from point E (output level Q3 on SRATC2) to point F (output level Q5 on SRATC3) ?
A) No,because they are already producing at their lowest possible cost at point E.
B) Yes,because the firm can take advantage of economies of scale.
C) Yes,because SRATC3 is the optimal plant size for this firm.
D) No,because producing at point F implies a higher cost per unit of output.
E) Yes,if the product price rises enough to lead the firm to expand to plant size 3.
Correct Answer:
Verified
Q84: A very-long-run consideration that could change a
Q85: The figure below shows a family of
Q94: Economists collect and analyze data on output
Q96: A change in the technique for producing
Q97: With respect to innovation,which of the following
Q102: Suppose RioTintoAlcan is considering the construction of
Q103: Which of the following statements most accurately
Q104: Suppose Commercial Footwear Inc.is making a cost-minimizing
Q108: What information is displayed by an isoquant?
A)the
Q118: Suppose RioTintoAlcan is considering the construction of
Unlock this Answer For Free Now!
View this answer and more for free by performing one of the following actions

Scan the QR code to install the App and get 2 free unlocks

Unlock quizzes for free by uploading documents