The diagram below shows the market for litres of milk.
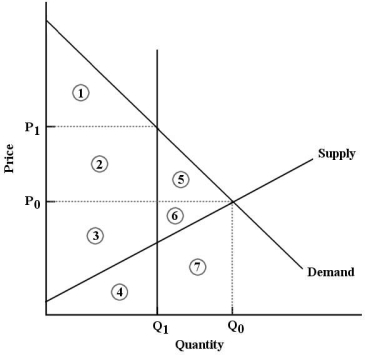 FIGURE 5-8
-Refer to Figure 5-8.After the imposition of a milk quota at quantity Q1,the deadweight loss in this market is represented by
A) area 1.
B) areas 1 and 4.
C) areas 1,2,and 5.
D) areas 5 and 6.
E) areas 5,6,and 7.
Correct Answer:
Verified
Q69: The diagram below shows the market for
Q72: The diagram below shows the market for
Q86: Consider a competitive market for good X.A
Q90: Each point on a supply curve shows
Q102: Suppose a binding output quota is imposed
Q103: Consider the following demand and supply schedules
Q113: Which of the following statements most accurately
Q115: One measure of the extent of market
Q117: In general (and in the absence of
Q124: Consider the following demand and supply schedules
Unlock this Answer For Free Now!
View this answer and more for free by performing one of the following actions

Scan the QR code to install the App and get 2 free unlocks

Unlock quizzes for free by uploading documents