The table below shows the demand schedule for museum admissions in a small city.
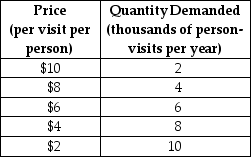 TABLE 4-1
-Refer to Table 4-1.Between the prices of $8 and $6 the price elasticity of demand is
A) 0.5.
B) 0.71.
C) 1.00.
D) 1.40.
E) 0.40.
Correct Answer:
Verified
Q3: Suppose that the quantity demanded of skipping
Q4: Suppose the price elasticity of demand for
Q5: Consider two demand curves and the same
Q6: The price elasticity of demand measures the
Q7: Suppose that the quantity of lemonade demanded
Q9: The table below shows the demand schedule
Q10: Suppose that the quantity of a good
Q11: If the price elasticity of demand is
Q12: The formula for the price elasticity of
Q13: The table below shows the demand schedule
Unlock this Answer For Free Now!
View this answer and more for free by performing one of the following actions

Scan the QR code to install the App and get 2 free unlocks

Unlock quizzes for free by uploading documents