The diagram below shows two production possibilities boundaries for Country X.
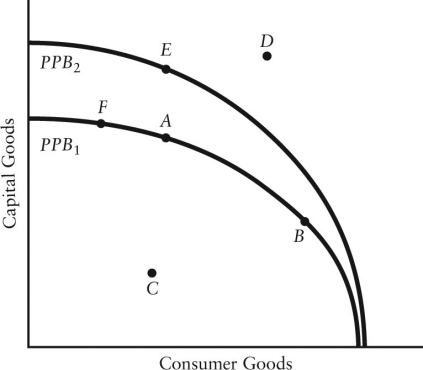 FIGURE 1-4
-Refer to Figure 1-4.An outward shift of the production possibilities boundary fromPPB1 to PPB2 indicates which of the following?
A) an increase in the price of raw materials for consumer goods
B) growth in the countryʹs productive capacity
C) an increase in the price of raw material for capital goods
D) more of the countryʹs resources are being used
E) the countryʹs resources are being used less efficiently
Correct Answer:
Verified
Q46: The diagram below shows two production possibilities
Q66: Consider the production possibilities boundary (PPB)of an
Q69: On a diagram of a production possibilities
Q79: If there is always a three-for-one trade-off
Q81: In recent years,several large Canadian-owned mining and
Q84: Consider Canada's production possibilities boundary.Suppose fire destroys
Q85: A move from inside the production possibilities
Q89: Suppose drought destroys many millions of acres
Q93: The downward-sloping line in the diagram below
Q95: The world price of oil fell in
Unlock this Answer For Free Now!
View this answer and more for free by performing one of the following actions

Scan the QR code to install the App and get 2 free unlocks

Unlock quizzes for free by uploading documents