The downward-sloping line in the diagram below shows the combinations of health care and education expenditures that the government can afford with a given amount of tax revenue. 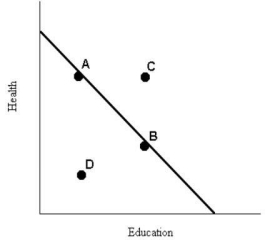 FIGURE 1-6
-Refer to Figure 1-6.The levels of health and education expenditures at point C
A) are less than at point D.
B) are equal to those of point A and point B.
C) are more cost-effective than those at points A,B,and D.
D) could be achieved if the prices of health and/or education increased.
E) are not attainable with the government's current budget.
Correct Answer:
Verified
Q62: On a diagram of a production possibilities
Q69: On a diagram of a production possibilities
Q71: Q72: Q73: The diagram below shows two production possibilities Q74: The diagram below shows two production possibilities Unlock this Answer For Free Now! View this answer and more for free by performing one of the following actions Scan the QR code to install the App and get 2 free unlocks Unlock quizzes for free by uploading documents![]()
![]()

