The table below shows data for the United States. 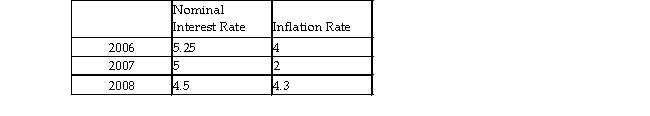 Between 2006 and 2007, the real interest rate _ and caused a the demand for loana funds curve.
A) increased; movement upward along
B) decreased; downward along
C) increased; rightward shift.
D) decreased; leftward.
Correct Answer:
Verified
Q217: What is the influence of the expected
Q218: Begin with the formula showing how households
Q226: A share of Apple stock costs $82.58
Q227: In 2007, France's exports totaled $490 billion
Q229: The table below shows data for the
Q231: In 2007, Singapore's government ran a budget
Q232: In January 2009, you can put your
Q233: In 2008, Germany had a budget deficit
Q234: In 2008, the financial and housing crisis
Q235: In 2008, the many people became unable
Unlock this Answer For Free Now!
View this answer and more for free by performing one of the following actions

Scan the QR code to install the App and get 2 free unlocks

Unlock quizzes for free by uploading documents