Multiple Choice
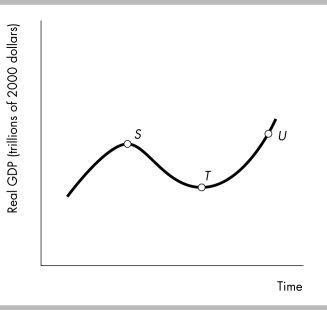
-In the above figure, the distance between points S and T represents
A) a trough.
B) a peak.
C) an expansion.
D) a recession.
Correct Answer:
Verified
Related Questions
Q216: A business cycle is
A) the pattern of
Q218: The productivity slowdown in the United States
Q219: Which of the following are parts of
Q219: Real GDP
A) can be called potential GDP
Q220: When real GDP is less than potential
Q223: A trough is the
A) lower turning point
Q224: Suppose the country of Dingo experienced an
Q225: Recessions are commonly defined to occur
A) when
Unlock this Answer For Free Now!
View this answer and more for free by performing one of the following actions

Scan the QR code to install the App and get 2 free unlocks

Unlock quizzes for free by uploading documents