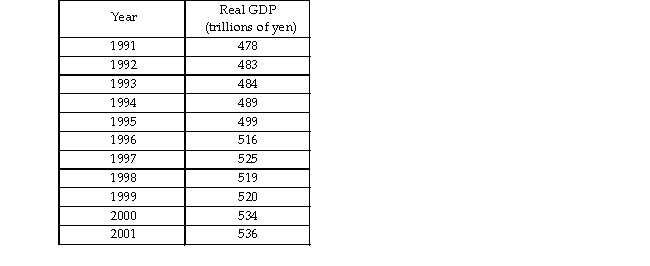
-The table above shows Japan's real GDP between 1991 to 2001.
a) Draw a figure with Japan's real GDP from 1991 to 2001.
b) In the previous 30 years, the growth rate of Japan's potential GDP was 6 percent a year. On your graph, show path that potential GDP would have followed if its GDP in 1991 was equal to potential GDP and the growth rate potential GDP had been maintained in 1991- 2001.
c) Show the Lucas wedge on your figure.
Correct Answer:
Verified
b) Potential G...
View Answer
Unlock this answer now
Get Access to more Verified Answers free of charge
Q321: Using a graph,draw and label the phases
Q343: Real GDP fluctuates from year to year
Q344: All economic activity in the underground economy
Q347: The omission of household production causes actual
Q356: To calculate GDP using the expenditure approach,
Q357: If a measure of real GDP could
Q364: The chain- weighted output index method of
Q365: Which of the following is TRUE regarding
Q366: Valuing the quantities of goods produced in
Q368: The chain- weighted output index
A) uses prices
Unlock this Answer For Free Now!
View this answer and more for free by performing one of the following actions

Scan the QR code to install the App and get 2 free unlocks

Unlock quizzes for free by uploading documents