Multiple Choice
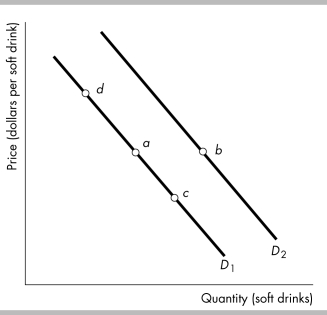
-Consider the demand curves for soft drinks shown in the figure above. A movement from point a to point b represents
A) a decrease in quantity demanded.
B) a decrease in demand.
C) an increase in quantity demanded.
D) an increase in demand.
Correct Answer:
Verified
Related Questions

