Multiple Choice
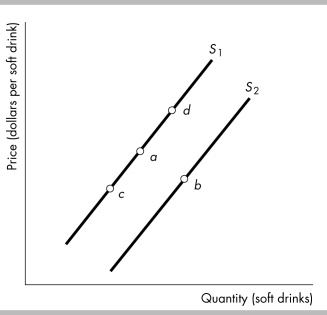
-Consider the figure above showing supply curves for soft drinks. Suppose the economy is at point
A. A decrease in the price of sugar used to make soft drinks is shown as a movement from point a to a point such as
A) none of the points that are illustrated.
B) point b.
C) point c.
D) point d.
Correct Answer:
Verified
Related Questions
Q199: A bakery can produce either cakes or
Q200: If the price of lumber rises, then,
Q201: Which of the following shifts the supply
Unlock this Answer For Free Now!
View this answer and more for free by performing one of the following actions

Scan the QR code to install the App and get 2 free unlocks

Unlock quizzes for free by uploading documents