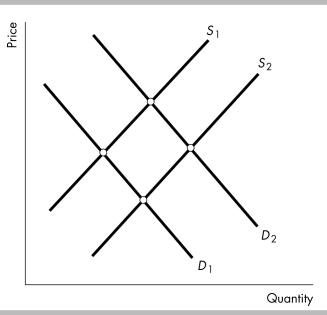
-The above figure represents the market for oil. When a hurricane destroys a major refinery the
A) demand curve for oil does not shift, and the supply curve for oil shifts from S2 to S1.
B) demand curve for oil shifts from D1 to D2 and the supply curve for oil shifts from S2 to S1.
C) demand curve for oil does not shift, and the supply curve for oil shifts from S1 to S2.
D) demand curve for oil shifts from D1 to D2 and the supply curve for oil does not shift.
Correct Answer:
Verified
Q227: The price of jet fuel falls. This
Q228: Q229: Which of the following influences does NOT Q230: Which of the following best reflects an Q231: Which of the following will increase the Q233: Q234: Q235: Consider the market for broccoli. If the Q236: Which of the following statements is TRUE? Q237: Unlock this Answer For Free Now! View this answer and more for free by performing one of the following actions Scan the QR code to install the App and get 2 free unlocks Unlock quizzes for free by uploading documents![]()
![]()
![]()
A)![]()

