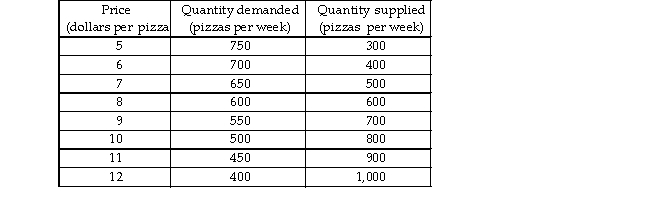
-A market research team has come up with the demand and supply schedules for pizza in Cheeseboro. These sch are given in the table above. Use these data to analyze the situation in the market for pizza.
a) Draw a figure showing the demand curve for pizza and the supply curve of pizza. What are the equilibrium and quantity?
b) Suppose the price is $10. Describe the situation in the market and explain how the price of pizza adjusts. No suppose the price is $6. Describe the situation in the market and explain how the price of pizza adjusts.
c) The market research report also includes a prediction about the effect on the market for pizza in Cheeseboro recent news published in Cheeseboro Herald. The Herald reported that pizza has been discovered to help preve diseases. Unfortunately, your dog chewed up the report and all you can read about the prediction is "quantity... by 150 at each price." What does the prediction say? Use your graph to show the predicted effects on the market for pizza. What are the predicted equilibrium price and quantity? How will the market adjust?
Correct Answer:
Verified
View Answer
Unlock this answer now
Get Access to more Verified Answers free of charge
Q469: Computers are a complement to computer software.
Q481: Q483: Soft drinks are a normal good. Draw Q487: Soft drinks and milk are substitutes for Q492: For consumers, chocolate chip cookies and doughnuts Q493: Q506: In the market for chocolate chip cookies, Q513: An increase in technology will shift the Q514: An increase in price results in increase Q543: Unlock this Answer For Free Now! View this answer and more for free by performing one of the following actions Scan the QR code to install the App and get 2 free unlocks Unlock quizzes for free by uploading documents![]()
![]()
![]()

