-The table above shows the aggregate production function in the economy of Prescottia. The people of Prescottia taxes and are willing to work 248 million hours a year for a real wage rate of $8 an hour, and for each dollar incr the real wage, they are willing to work 4 million additional hours per year.
a) Draw the economy's aggregate production function.
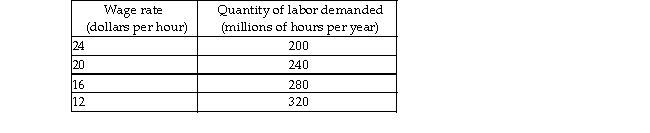
b) Prescottia's demand for labor schedule is in the table above. Draw Prescottia's demand for labor and supply curves.
c) What are the economy's full- employment quantity of labor and real wage rate? What is the country's potent GDP?
d) Suppose that Prescottia's government introduces a 25 percent income tax. Using your graph, what happens t demand for labor? What happens to the supply of labor? Explain.
e) After the tax is imposed, what happens to Prescottia's full- employment quantity of labor? What happens to Prescottia's potential GDP?
Correct Answer:
Verified
View Answer
Unlock this answer now
Get Access to more Verified Answers free of charge
Q248: Personal income taxes are the largest source
Q256: The Ricardo-Barro effect implies that a budget
Q258: The structural surplus measures whether a budget
Q259: By its very definition, every budget deficit
Q263: The aggregate demand curve is shifted rightward
Q320: An increase in taxes on labor income
Q321: In the short run, a contractionary fiscal
Q322: Induced taxes decrease the size of the
Q324: Induced taxes increase the size of the
Q326: Automatic stabilizers are not subject to all
Unlock this Answer For Free Now!
View this answer and more for free by performing one of the following actions

Scan the QR code to install the App and get 2 free unlocks

Unlock quizzes for free by uploading documents