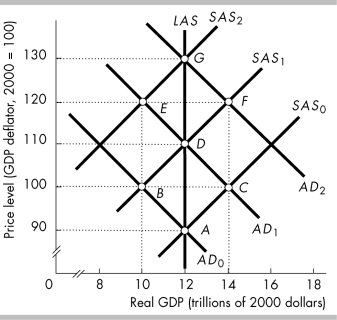
-In the above figure, which path represents a cost- push inflation?
A) point A to C to D to E to G
B) point A to B to D to E to G
C) point A to B to D to F to G
D) point A to C to D to F to G
Correct Answer:
Verified
Q83: Suppose oil prices rise. The Fed can_
Q90: A one-time increase in the price of
Q105: Q106: In a cost- push inflation, Q108: Stagflation results from Q111: To prevent cost- push inflation Q112: For a cost- push inflation to occur, Q113: When the price level rises and simultaneously Q114: One example of cost- push inflation is Q115: During a cost- push inflation spiral, the![]()
A) decreases in
A) an increase in government
A) there must
Unlock this Answer For Free Now!
View this answer and more for free by performing one of the following actions

Scan the QR code to install the App and get 2 free unlocks

Unlock quizzes for free by uploading documents