Multiple Choice
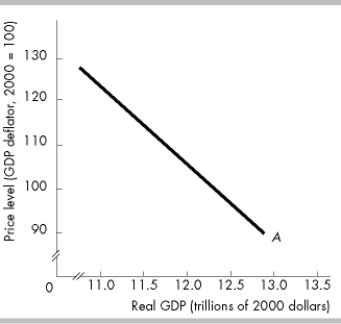
-The curve labeled A in the above figure is
A) a production possibilities curve.
B) a short- run aggregate supply curve.
C) an aggregate demand curve.
D) a long- run aggregate supply curve.
Correct Answer:
Verified
Related Questions
Q218: Which of the following increases aggregate demand?
A)
Q219: Aggregate demand decreases when
A) businesses come to
Q220: Aggregate demand will increase if the quantity

