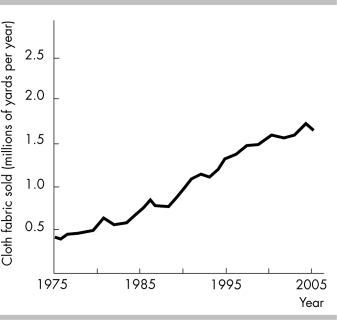
-In the above figure, the amount of cloth fabric sold over time exhibits
A) an upward trend.
B) a downward trend.
C) no trend.
D) None of the above because the figure cannot show the trend of the amount of cloth fabric sold.
Correct Answer:
Verified
Q341: A time- series graph showing total production
Q342: You think that the volume of textiles
Q343: A time- series graph showing the unemployment
Q344: Time- series graphs can quickly convey information
Q345: To show how a variable , we
Q347: Which type of graph is used to
Q350: A graph that measures time on the
Unlock this Answer For Free Now!
View this answer and more for free by performing one of the following actions

Scan the QR code to install the App and get 2 free unlocks

Unlock quizzes for free by uploading documents