Multiple Choice
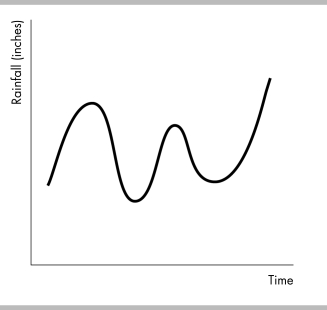
-The figure above shows a
A) scatter diagram.
B) regression.
C) time- series graph.
D) two- variable time- series graph.
Correct Answer:
Verified
Related Questions
Q355: Q356: Demonstrating how an economic variable differs across Q357: Q358: From a time- series graph showing sales Q359: On a time- series graph, time is Q361: Suppose that we plot, on a bar Q362: A trend shows Q363: A cross- section graph examines Q364: Which of the following is TRUE regarding Q365: A graph shows the wages of factory![]()
![]()
A) the scale used to
A) one variable
Unlock this Answer For Free Now!
View this answer and more for free by performing one of the following actions

Scan the QR code to install the App and get 2 free unlocks

Unlock quizzes for free by uploading documents