Multiple Choice
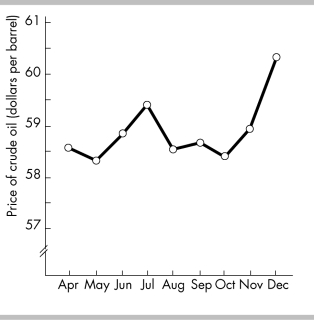
-Using the above figure, during which of the following periods does the price of crude oil have a downward trend?
A) May to July
B) October to December
C) May to November
D) July to October
Correct Answer:
Verified
Related Questions
Q346: Q347: Which type of graph is used to Q350: A graph that measures time on the Q352: The horizontal axis on a time- series Q353: To see how variables evolve over time Unlock this Answer For Free Now! View this answer and more for free by performing one of the following actions Scan the QR code to install the App and get 2 free unlocks Unlock quizzes for free by uploading documents![]()

