Multiple Choice
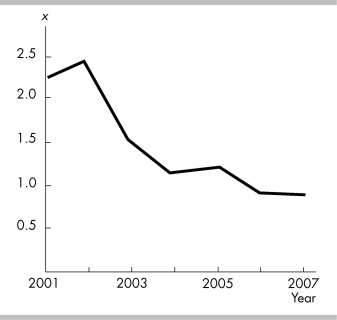
-In the above figure, the diagram shows
A) a downward trend in x.
B) an upward trend in x.
C) a two- variable scatter diagram.
D) a scatter diagram.
Correct Answer:
Verified
Related Questions
Q365: A graph shows the wages of factory
Q366: For cross- section graphs
A) it is always
Q367: A graph shows the average wage of
Q368: A time- series graph displays the price
Q369: A cross- section graph shows the value
Q371: Q372: A trend is Q373: Which type of graph shows the values Q374: A time- series graph displaying real GDP Q375: ![]()
A) the maximum value of![]()
Unlock this Answer For Free Now!
View this answer and more for free by performing one of the following actions

Scan the QR code to install the App and get 2 free unlocks

Unlock quizzes for free by uploading documents