Multiple Choice
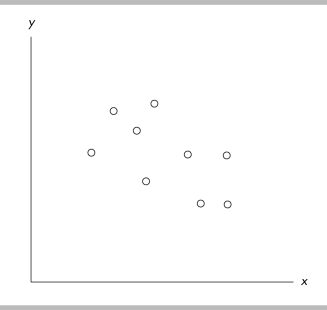
-The figure above is an example of a
A) scatter diagram.
B) cross- section graph.
C) time- series graph.
D) regression.
Correct Answer:
Verified
Related Questions
Q389: Which type of graph is most useful
Q390: Using a graph to plot family incomes
Q391: You have data for real income per
Q392: You notice that when interest rates increases,
Unlock this Answer For Free Now!
View this answer and more for free by performing one of the following actions

Scan the QR code to install the App and get 2 free unlocks

Unlock quizzes for free by uploading documents