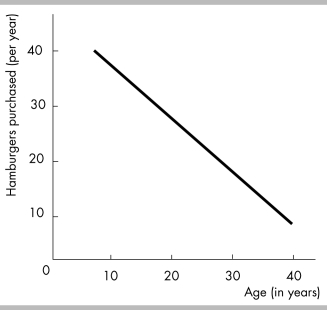
-The above figure depicts a
A) positive non- linear relationship between age and the number of hamburgers purchased per year.
B) positive linear relationship between age and the number of hamburgers purchased per year.
C) negative linear relationship between age and the number of hamburgers purchased per year.
D) negative non- linear relationship between age and the number of hamburgers purchased per year.
Correct Answer:
Verified
Q311: A graph shows that as fees to
Q338: Q449: A scatter diagram with the price of Q450: "The price of long distance phone calls Q451: Suppose that we find that student grades Q452: As the number of days without rain![]()
Unlock this Answer For Free Now!
View this answer and more for free by performing one of the following actions

Scan the QR code to install the App and get 2 free unlocks

Unlock quizzes for free by uploading documents