Multiple Choice
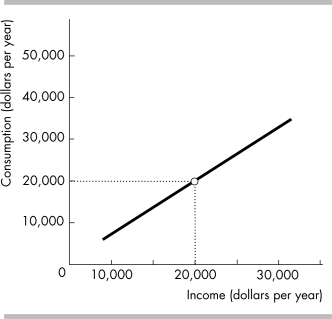
-The relationship between income and consumption illustrated in the figure above is
A) positive and linear.
B) negative and nonlinear.
C) negative and linear.
D) positive and nonlinear.
Correct Answer:
Verified
Related Questions
Q479: Q480: Q481: Q482: Q483: "The change in the value of the Q485: The slope of a line equals the Q486: Consider a diagram in which the variable Unlock this Answer For Free Now! View this answer and more for free by performing one of the following actions Scan the QR code to install the App and get 2 free unlocks Unlock quizzes for free by uploading documents![]()
![]()
![]()
![]()
A)

