Multiple Choice
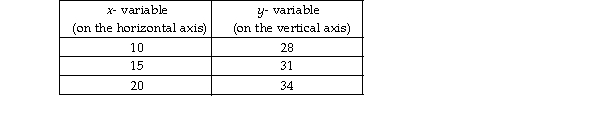
-The above table shows data on two variables. If these data were graphed, the slope of the line would be
A) 5/3.
B) 3.
C) 3/5.
D) impossible to determine from the information given.
Correct Answer:
Verified
Related Questions
Q370: Q397: Q528: If the change in y = 10, Q529: Q530: The slope of a straight line is Q531: The change in y = - 20, Q532: The above table gives data on two Q535: With y measured on the vertical axis Q536: Q537: Unlock this Answer For Free Now! View this answer and more for free by performing one of the following actions Scan the QR code to install the App and get 2 free unlocks Unlock quizzes for free by uploading documents![]()
![]()
![]()
![]()

