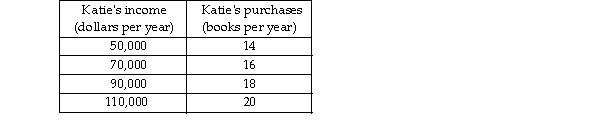
-The table above shows how the number of books Katie buys each year depends on her income.
a) What kind of relationship exists between Katie's income and the number of books she purchases?
b) Plot the relationship between Katie's income and the number of books she purchases in the above figure. Me income along the vertical axis and the number of books along the horizontal axis. Be sure to label the axes.
c) What is the slope of the relationship between $50,000 and $70,000 of income?
d) What is the slope of the relationship between $90,000 and $110,000 of income?
e) Comment on the similarity or dissimilarity of your answers to parts (c) and (d).
Correct Answer:
Verified
View Answer
Unlock this answer now
Get Access to more Verified Answers free of charge
Q387: A time series graph can show both
Q461: Q466: The slope of a line is the Q467: The vertical axis of a graph shows Q471: If the change in the y-axis variable Q478: A cross-section graph can show how economic Q479: If the x-axis variable increases while the Q481: "Ceteris paribus" refers to the idea that Q482: If the change in the y-axis variable Q483: To graph a relationship that involves more![]()
Unlock this Answer For Free Now!
View this answer and more for free by performing one of the following actions

Scan the QR code to install the App and get 2 free unlocks

Unlock quizzes for free by uploading documents