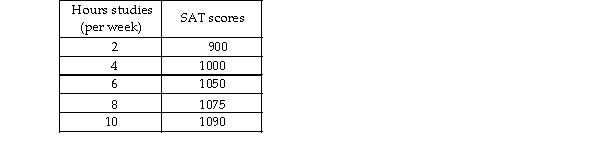
-Jamie is preparing to take his SAT tests. The table above shows how Jamie's score depends on the number of hou week Jamie studies.
a) Plot the relationship in the figure, putting the hours studied on the horizontal axis.
b) Is the relationship you plotted positive or negative?
c) What happens to the slope of the relationship as hours studied increase?
d) Suppose Jamie can enroll in an SAT prep course and, by so doing, for every possible number of hours he stu score will be 100 points higher. Plot the new relationship between the number of hours studied and Jamie's SAT the figure.
e) How many variables are involved in the figure you just completed?
Correct Answer:
Verified
View Answer
Unlock this answer now
Get Access to more Verified Answers free of charge
Q387: A time series graph can show both
Q461: Q464: Q465: A graph cannot be used to show Q467: The vertical axis of a graph shows Q473: The slope of a straight line increases Q476: When graphed, variables that are unrelated are Unlock this Answer For Free Now! View this answer and more for free by performing one of the following actions Scan the QR code to install the App and get 2 free unlocks Unlock quizzes for free by uploading documents![]()
![]()

