Multiple Choice
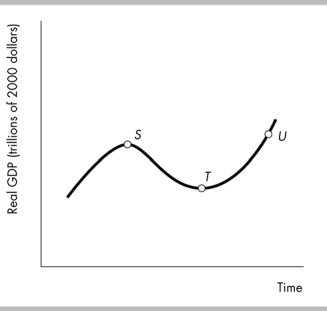
-In the above figure, the distance between points S and T represents
A) a recession.
B) a trough.
C) a peak.
D) an expansion.
Correct Answer:
Verified
Related Questions
Q228: A peak is the
A) upper turning point
Q229: An expansion occurs when the level of
Q230: Real GDP is not a perfect indicator
Unlock this Answer For Free Now!
View this answer and more for free by performing one of the following actions

Scan the QR code to install the App and get 2 free unlocks

Unlock quizzes for free by uploading documents