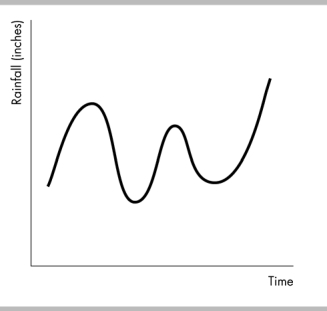
-The figure above shows a
A) regression.
B) two-variable time-series graph.
C) time-series graph.
D) scatter diagram.
Correct Answer:
Verified
Q340: Assume a small nation has the following
Q342: Q343: Real GDP fluctuates from year to year Q344: All economic activity in the underground economy Q345: Household production is not measured in the Q346: Phases and turning points of the business Q349: To calculate GDP when using the income Q350: To see how variables evolve over time Q351: The largest component of income is proprietors' Q358: A productivity growth slowdown can be shown
Unlock this Answer For Free Now!
View this answer and more for free by performing one of the following actions

Scan the QR code to install the App and get 2 free unlocks

Unlock quizzes for free by uploading documents