Multiple Choice
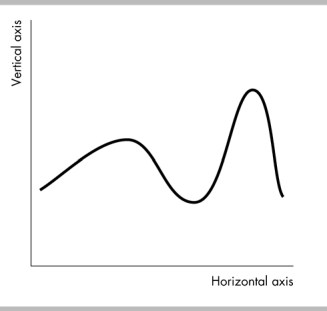
-The figure above shows a time-series graph. The horizontal axis measures and the vertical axis measures .
A) time; the variable of interest
B) y-values; the variable of interest
C) the variable of interest; time
D) time; x-values
Correct Answer:
Verified
Related Questions
Q352: To measure economic welfare, one needs only
Q354: A recession occurs when real GDP decreases
Q357: If a measure of real GDP could
Q359: The business cycle progresses from an expansion
Q360: The fact that prices for similar goods
Unlock this Answer For Free Now!
View this answer and more for free by performing one of the following actions

Scan the QR code to install the App and get 2 free unlocks

Unlock quizzes for free by uploading documents