Multiple Choice
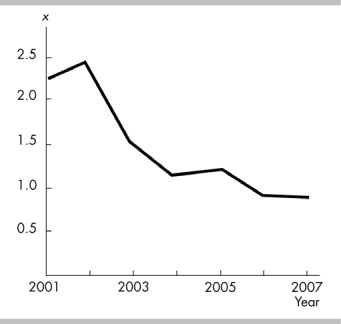
-In the above figure, the diagram shows
A) a downward trend in x.
B) a two-variable scatter diagram.
C) an upward trend in x.
D) a scatter diagram.
Correct Answer:
Verified
Related Questions
Q369: A time-series graph showing total production in
Q370: On a time-series graph, time is typically
Q371: A time-series graph displays the price of
Q372: The horizontal axis on a time-series graph
A)
Q373: Which of the following is TRUE regarding
Unlock this Answer For Free Now!
View this answer and more for free by performing one of the following actions

Scan the QR code to install the App and get 2 free unlocks

Unlock quizzes for free by uploading documents