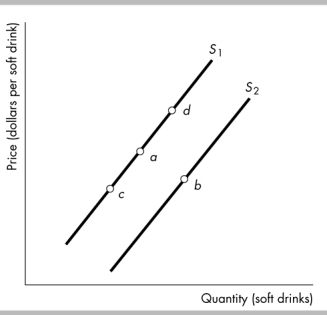
-The figure above shows supply curves for soft drinks. Suppose the economy is at point a. A movement to point c could be the result of
A) a decrease in technology.
B) an increase in the relative price of a soft drink.
C) a decrease in the relative price of a soft drink.
D) an increase in the money price of a soft drink.
Correct Answer:
Verified
Q186: Q187: Q191: Which of the following leads to a Q193: A decrease in the quantity supplied is Q194: For a "change in the quantity supplied" Q195: Which of the following shifts the supply Q197: Which of the following shifts the supply Q198: If the price of a good changes Q199: Q201: Unlock this Answer For Free Now! View this answer and more for free by performing one of the following actions Scan the QR code to install the App and get 2 free unlocks Unlock quizzes for free by uploading documents![]()
![]()
![]()
![]()

