Multiple Choice
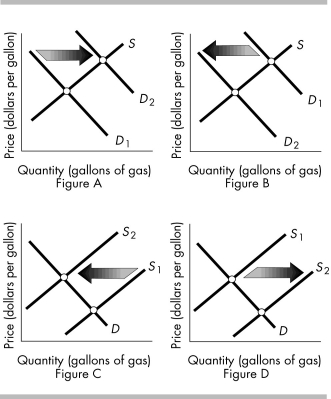
-The above figures show the market for gasoline. Which figure shows the effect of motorists increasing the number of times they take the bus to work rather than driving their own cars?
A) Figure A
B) Figure B
C) Figure C
D) Figure D
Correct Answer:
Verified
Related Questions

