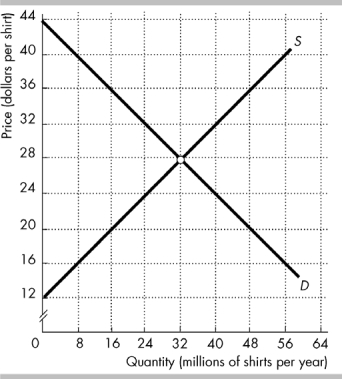
The figure shows the market for shirts in the United States, where D is the domestic demand curve and S is the domestic supply curve. The world price is $20 per shirt. The United States imposes a tariff on imported shirts, $4 per shirt.
-In the figure above, the tariff_________ the domestic production of shirts in the United States by_________ per year.
A) increases; 4 million
B) decreases; 8 million
C) decreases; 16 million
D) increases; 8 million
Correct Answer:
Verified
Q40: Suppose the country of Atlantica imposes a
Q41: Lowering the tariff on good X will
A)
Q42: During the Great Depression in the 1930s,
Q43: Reducing a tariff will _the domestic production
Q44: Q46: Average tariff levels in the United States Q47: A U.S. tariff on textiles would _U.S. Q48: The Smoot-Hawley Act Q49: U.S. tariffs in the peaked in Q50: ![]()
A) made most tariffs illegal.
B)
A) 1940.
B)![]()
Unlock this Answer For Free Now!
View this answer and more for free by performing one of the following actions

Scan the QR code to install the App and get 2 free unlocks

Unlock quizzes for free by uploading documents