Multiple Choice
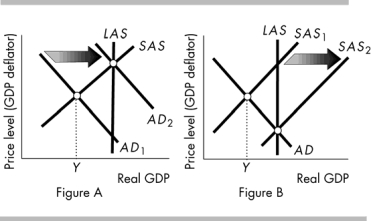
-Which aggregate supply-aggregate demand diagram above shows the effect on real GDP and the price level of monetary policy when it is used to fight a recession?
A) Neither Figure A nor Figure B
B) Both Figure A and Figure B
C) Only Figure A
D) Only Figure B
Correct Answer:
Verified
Related Questions

