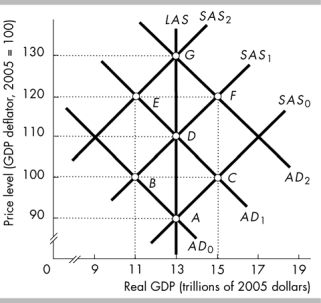
-In the above figure, which path represents a cost-push inflation?
A) point A to C to D to F to G
B) point A to B to D to F to G
C) point A to C to D to E to G
D) point A to B to D to E to G
Correct Answer:
Verified
Q107: The anticipated inflation rate is 5 percent.
Q109: To prevent cost-push inflation
A) interest rates must
Q110: In a cost-push inflation,
A) decreases in SAS
Q111: When workers and employers correctly anticipate an
Q113: As far as cost-push inflation goes, the
Q114: The economy is at potential GDP when
Q115: Q116: Suppose aggregate demand increases by more than Q117: During which decade did the United States Q229: ![]()
![]()
Unlock this Answer For Free Now!
View this answer and more for free by performing one of the following actions

Scan the QR code to install the App and get 2 free unlocks

Unlock quizzes for free by uploading documents