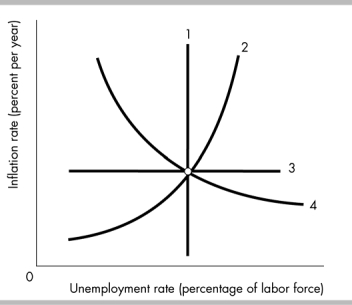
-In the above figure, which of the following curves represents the long -run Phillips curve?
A) 4
B) 1
C) 3
D) 2
Correct Answer:
Verified
Q158: Suppose the expected inflation rate is 12
Q159: The short-run Phillips curve shows the tradeoff
Q160: For a given level of anticipated inflation
Q162: The long-run Phillips curve shows the relationship
Q164: The long-run Phillips curve is _.
A) vertical
Q165: The long-run Phillips curve is
A) vertical at
Q166: Which of the following statements about the
Q167: Along the long-run Phillips curve,
A) actual inflation
Q168: An increase in the natural unemployment rate
Q176: ![]()
Unlock this Answer For Free Now!
View this answer and more for free by performing one of the following actions

Scan the QR code to install the App and get 2 free unlocks

Unlock quizzes for free by uploading documents