Multiple Choice
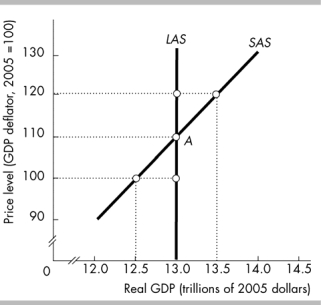
-In the figure above, potential GDP equals
A) $13.5 trillion.
B) $13.0 trillion.
C) $12.5 trillion.
D) None of the above answers is correct.
Correct Answer:
Verified
Related Questions
Q39: If the money wage and other resource
Q40: The positive relationship between short-run aggregate supply
Q41: Suppose the price level, the money wage,
Q42: The SAS curve shifts if there is
Q43: Which of the following changes does NOT
Q45: Which of the following events will increase
Q46: A decrease in the price level accompanied
Q47: All of the following shift the LAS
Unlock this Answer For Free Now!
View this answer and more for free by performing one of the following actions

Scan the QR code to install the App and get 2 free unlocks

Unlock quizzes for free by uploading documents