Multiple Choice
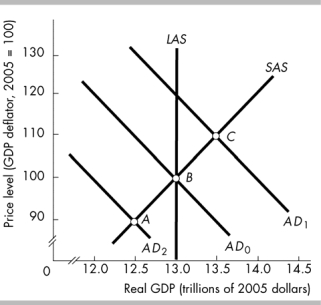
-In the above figure, point A represents
A) an increase in aggregate demand.
B) a recessionary gap.
C) an inflationary gap.
D) a full-employment equilibrium.
Correct Answer:
Verified
Related Questions
-In the above figure, point A represents
A) an increase in aggregate demand.
B) a recessionary gap.
C) an inflationary gap.
D) a full-employment equilibrium.
Correct Answer:
Verified

