Multiple Choice
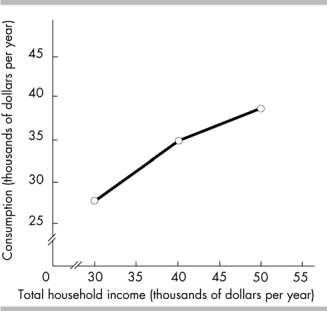
-The above figure shows the relationship between the Jonesesʹ total consumption and total household income. The figure illustrates that the Jonesesʹ total consumption varies
A) inversely with their total household income.
B) independently of their total household income.
C) negatively with their income.
D) directly with their total household income.
Correct Answer:
Verified
Related Questions
Q291: If you study 3 hours for an
Q292: If variable x always increases when variable
Q293: Q294: As a firm produces more and more

