Multiple Choice
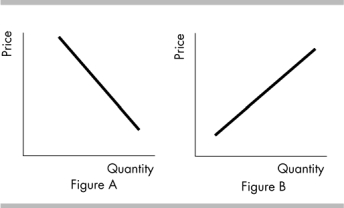
-In the above figure, a negative relationship between price and quantity is shown in
A) Figure A.
B) Figure B.
C) Neither Figure A nor Figure B.
D) Both Figure A and Figure B.
Correct Answer:
Verified
Related Questions
Q302: Q303: Q304: Q305: As a firm expands its output, cost Q306: If a graph shows a negative relationship Q308: Suppose that we find that student grades Q309: As a curve approaches a maximum point, Unlock this Answer For Free Now! View this answer and more for free by performing one of the following actions Scan the QR code to install the App and get 2 free unlocks Unlock quizzes for free by uploading documents![]()
![]()

