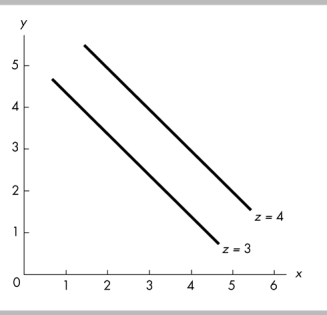
-In the figure above, an increase in z leads to a
A) rightward shift of the line showing the relationship between x and y.
B) leftward shift of the line showing the relationship between x and y.
C) movement down along one of the lines showing the relationship between x and y.
D) movement up along one of the lines showing the relationship between x and y.
Correct Answer:
Verified
Q426: In the above figure, if household consumption
Q427: Q428: Q429: On a graph showing the relationship between Q430: Q432: Household consumption depends on both income and Q433: Q434: Ceteris paribus when graphing a relationship refers Q435: The relationship in the above figure indicates Q436: Unlock this Answer For Free Now! View this answer and more for free by performing one of the following actions Scan the QR code to install the App and get 2 free unlocks Unlock quizzes for free by uploading documents![]()
![]()
![]()
![]()
![]()

