-The table above shows how the number of books Katie buys each year depends on her income.
a) What kind of relationship exists between Katieʹs income and the number of books she purchases?
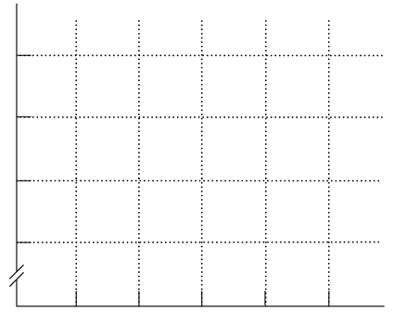
b) Plot the relationship between Katieʹs income and the number of books she purchases in the above figure. Measure income along the vertical axis and the number of books along the horizontal axis. Be sure to label the axes.
c) What is the slope of the relationship between $50,000 and $70,000 of income?
d) What is the slope of the relationship between $90,000 and $110,000 of income?
e) Comment on the similarity or dissimilarity of your answers to parts c) and d).
Correct Answer:
Verified
View Answer
Unlock this answer now
Get Access to more Verified Answers free of charge
Q442: What does the slope of the line
Q443: A graph of two variables is a
Q444: Q445: Q445: What does the slope of a straight Q447: What does the slope of the Q448: What does the slope of the line Q450: ʺIt is impossible to represent a three Q451: A graph has a point that is Q468: Unlock this Answer For Free Now! View this answer and more for free by performing one of the following actions Scan the QR code to install the App and get 2 free unlocks Unlock quizzes for free by uploading documents![]()
![]()
![]()

