The table below shows government purchases (G) ,net tax revenues (T) ,and debt-service payments (iD) over a 4-year period for a hypothetical economy.All figures are in billions of dollars.Assume the stock of debt at the end of 2012 is $500 billion.
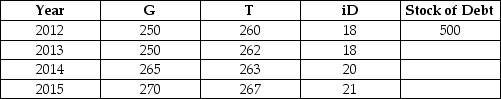 TABLE 31-1
-Refer to Table 31.1.What is the budget deficit in 2015?
A) -$24 billion
B) $24 billion
C) -$3 billion
D) $3 billion
E) $21 billion
Correct Answer:
Verified
Q22: Suppose the stock of government debt in
Q24: Suppose during one fiscal year,government purchases are
Q29: Consider two economies,A and B.Economy A has
Q30: The table below shows government purchases (G),net
Q31: Suppose the stock of government debt in
Q32: The Canadian federal debt-to-GDP ratio reached a
Q37: The stock of government debt will continue
Q38: The table below shows government purchases (G),net
Q39: The table below shows government purchases (G),net
Q40: The Canadian federal government's net debt as
Unlock this Answer For Free Now!
View this answer and more for free by performing one of the following actions

Scan the QR code to install the App and get 2 free unlocks

Unlock quizzes for free by uploading documents