The table below shows government purchases G) , net tax revenues T) , and debt-service payments iD) over a 4-year period for a hypothetical economy. All figures are in billions of dollars. Assume the stock of debt at the end of 2012 is $500 billion. 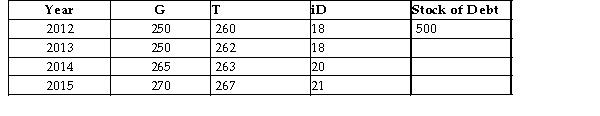 TABLE 31-1
-Consider two economies, A and B. Economy A has a stock of government debt equal to $800 billion and a
Debt-to-GDP ratio of 10%. Economy B has a stock of government debt equal to $22 billion and a debt -to-GDP ratio of 80%. What is the GDP for each economy?
A) Economy A: GDP = $8 trillion Economy B: GDP = $27.5 billion
B) Economy A: GDP = $80 billion Economy B: GDP = $18.7 billion
C) Economy A: GDP = $80 trillion Economy B: GDP = $275 billion
D) Economy A: GDP = $800 billion Economy B: GDP = $22 billion
E) Economy A: GDP = $8 trillion Economy B: GDP = $2.75 billion
Correct Answer:
Verified
Q21: Suppose during one fiscal year,government purchases are
Q21: The table below shows government purchases (G),net
Q22: Suppose the stock of government debt in
Q25: If the government's total budget surplus is
Q31: Suppose the stock of government debt in
Q32: The Canadian federal government's debt-to-GDP ratio climbed
Q35: The table below shows government purchases (G),net
Q38: If the governmentʹs total budget deficit is
Q39: The table below shows government purchases (G),net
Q40: The Canadian federal government's net debt as
Unlock this Answer For Free Now!
View this answer and more for free by performing one of the following actions

Scan the QR code to install the App and get 2 free unlocks

Unlock quizzes for free by uploading documents