The labour market in the diagram below begins in equilibrium with a real wage of $10 and quantity employed of 1000.
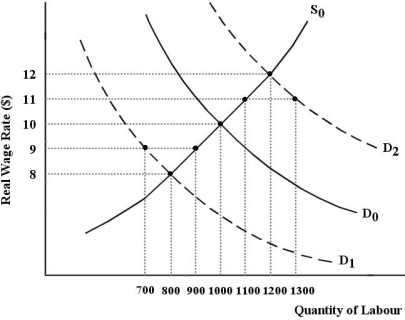 FIGURE 30-1
-Refer to Figure 30-1.Given the labour supply and labour demand curves,D0 and S0,which of the following statements is true in the market-clearing theory of unemployment?
A) At any wage above $10,there is an excess demand for labour,and the wage will be driven down.
B) At any wage above $10,there is an excess supply of labour,and the wage will be driven down.
C) At any wage above $10,there is persistent,involuntary unemployment.
D) At any wage below $10,there is an excess supply of labour,and the wage will be driven up.
E) At any wage below $10,there is an excess demand for labour,and the wage will be driven down.
Correct Answer:
Verified
Q23: The table below provides hypothetical unemployment,employment,and labour
Q25: The table below provides hypothetical unemployment,employment,and labour
Q27: Market-clearing theories of the labour market argue
Q29: The table below provides hypothetical unemployment,employment,and labour
Q31: The table below provides hypothetical unemployment,employment,and labour
Q34: Market-clearing theories of the labour market feature
Q38: The table below provides hypothetical unemployment,employment,and labour
Q38: Market-clearing theories of the labour market assume
Q39: Empirical observation of employment and real-wage fluctuations
Q40: What economists sometimes call "voluntary unemployment" occurs
Unlock this Answer For Free Now!
View this answer and more for free by performing one of the following actions

Scan the QR code to install the App and get 2 free unlocks

Unlock quizzes for free by uploading documents