The labour market in the diagram below begins in equilibrium with a real wage of $10 and quantity employed of 1000.
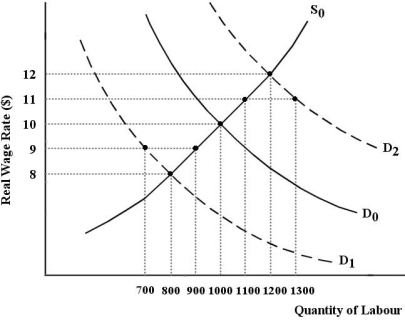 FIGURE 30-1
-Refer to Figure 30-1. The economy begins with D0 and S0. Suppose there is a positive shock to the economy which shifts the demand for labour curve to D2. Which of the following explains why the wage might rise only to $11 but not enough to clear the market?
1) Firms may find it costly to make large changes in wages.
2) Wages are set only infrequently in contracts and are thus slow to respond to changes in demand.
3) The wage rate is slow to adjust when there are long-term employment relationships.
A) 1 and 2
B) 2 and 3
C) 1, 2, and 3
D) 2 only
E) 3 only
Correct Answer:
Verified
Q27: The labour market in the diagram below
Q42: Which statement by an employer is consistent
Q46: The labour market in the diagram below
Q48: A likely consequence of firms paying "efficiency
Q49: Long-term labour contracts are an important feature
Q50: The theory of "efficiency wages" suggests that
Q51: In non-market-clearing theories of the labour market,an
Q57: Retaining a core group of experienced employees
Q58: The theory of "efficiency wages" provides
A)a way
Q60: The labour market in the diagram below
Unlock this Answer For Free Now!
View this answer and more for free by performing one of the following actions

Scan the QR code to install the App and get 2 free unlocks

Unlock quizzes for free by uploading documents