The table below shows the percentage of the labour force accounted for by males and females over a two-decade period.Assume that real GDP is equal to potential in each of the given years.
% of Labour Force
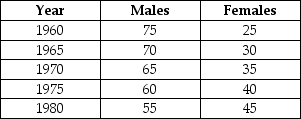 TABLE 30-4
-Refer to Table 30-4.Suppose that for each year listed the unemployment rate among males is 5% while it is 7% among females.By how much does this economy's NAIRU change between 1960 and 1975?
A) it decreases by 1 percentage point
B) it remains the same
C) it increases by 0.5 percentage point
D) it increases by 0.3 percentage point
E) it increases by 0.2 percentage point
Correct Answer:
Verified
Q103: Many economists believe that the more strict
Q105: Other things being equal,many economists believe that
Q107: Suppose the Canadian government implements a new
Q109: Which of the following would be the
Q110: The table below shows the percentage of
Q113: One motivation for having publicly subsidized retraining
Q115: Which of the following policies could the
Q115: The economy in the diagram below begins
Q116: Which of the following best explains why
Q116: The economy in the diagram below begins
Unlock this Answer For Free Now!
View this answer and more for free by performing one of the following actions

Scan the QR code to install the App and get 2 free unlocks

Unlock quizzes for free by uploading documents