The three figures below show the phases of a disinflation. In part i) , the economy is experiencing a sustained inflation at E 1.
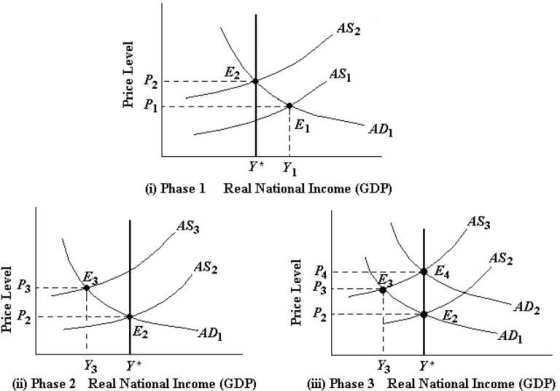 FIGURE 29-4
-Refer to Figure 29-4, part ii) or iii) . A movement of the economy from E3 to E2 could be due to
A) a slow fall in wages due to the recessionary gap.
B) an expansionary monetary policy.
C) a contractionary monetary policy.
D) a rise in unit costs caused by falling wages.
E) a positive aggregate demand shock.
Correct Answer:
Verified
Q82: 29.3 Reducing Inflation
The three figures below show
Q100: 29.3 Reducing Inflation
The three figures below show
Q103: Suppose policymakers are faced with ending a
Q105: If a central bank is to successfully
Q109: The sacrifice ratio reflects the cost of
Q113: It is difficult for the Bank of
Q114: The sacrifice ratio is calculated by
A)dividing the
Q115: In general,the sacrifice ratio will be greater,the
A)shorter
Q116: In general,the sacrifice ratio will be smaller,the
A)shorter
Q120: Of the three phases involved in the
Unlock this Answer For Free Now!
View this answer and more for free by performing one of the following actions

Scan the QR code to install the App and get 2 free unlocks

Unlock quizzes for free by uploading documents